June Stats | 六月數據 |
Sales : 2,418 (Down 11.5% from May) | 銷售 : 2,418 (相比五月下跌11.5% ) |
| Month of Inventory : 5.87 (Balanced Market) | 庫存月份 : 5.87 (平衡市場) |
Home Price : 1,207,100 (Down 0.4% from May) | 價格指數 : 1,207,100 (相比五 月下跌0.4%) |
In June 2024, Vancouver's real estate market showed a notable shift compared to previous periods. Sales reached 2,418 units, marking an 11.5% decline from May's 2,733 units and a significant 19.1% drop from June 2023's 2,988 units. This performance sits 23.6% below the 10-year average, reflecting a broader cooling trend.
The total number of homes available for sale surged to 14,182, up 4.3% from last month's 13,600 and a substantial 42% rise from last June's 9,990. This influx pushed new listings 20% above the 10-year average, indicating increased seller activity.
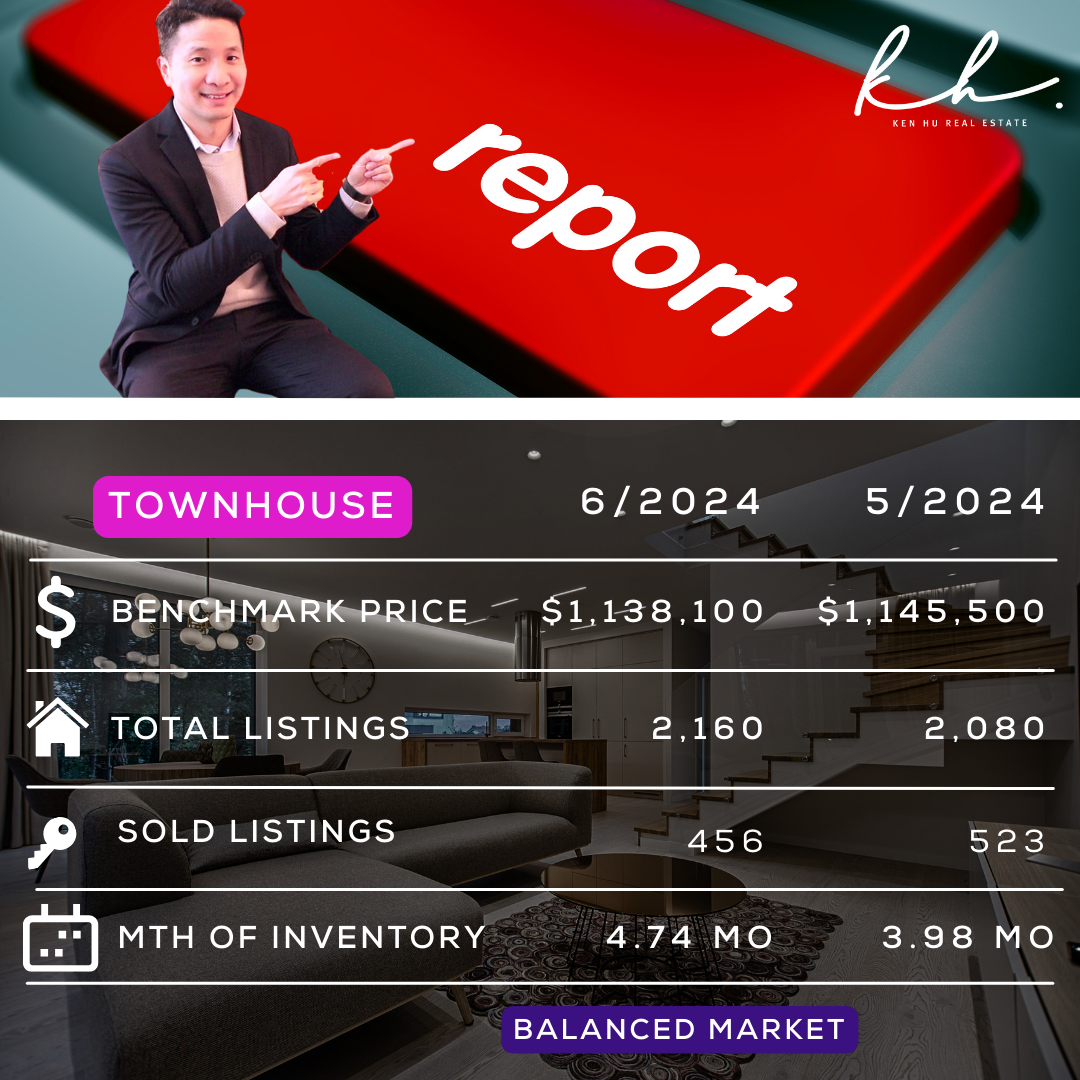
The Months of Inventory (MOI) climbed to 5.87, compared to 4.98 in May and 3.34 last June, suggesting a slower market with more inventory available. Notably, townhouses reached their highest MOI of the year, hinting at a potential oversupply in this segment.
The Home Price Index (HPI) for June was $1,207,100, a slight 0.4% decrease from May's $1,212,000 but a 0.3% increase from $1,203,000 in June 2023, this also reverses the price upward trend since the beginning of the year.
While most areas are in the buyer’s territory, there are certain outliers. If you are curious about how your area is performing, make sure to download the free market report below. If you have any questions, send me a DM to chat.

2024年6月,溫哥華的房地產市場與去年相比發生了顯著變化。銷售量為2,418,較5月的2,733下降了11.5%,較2023年6月的2,988大幅下降了19.1%。這一表現低於十年平均水平的23.6%,反映了市場的降溫趨勢。
房源總數激增至14,182個,比上月的13,600增加了4.3%,比去年6月的9,990大幅增加了42%。這一激增使新房源數量高於十年平均水平的20%,表明市場供給大於需求。
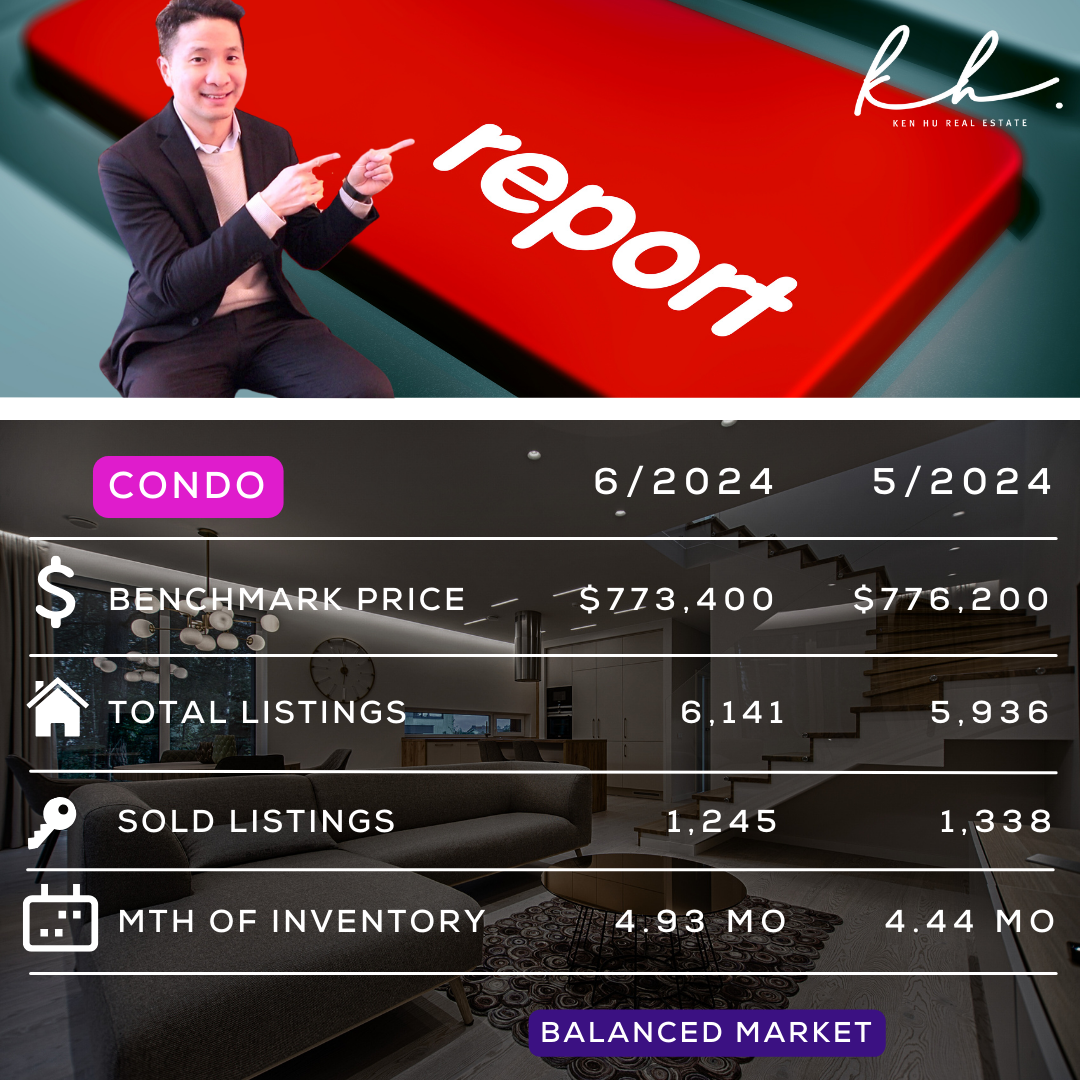
庫存月數(MOI)攀升至5.87,較5月的4.98和去年6月的3.34有顯著增加,市場持續放緩,供應量增加。值得注意的是, 除了獨立屋為買家市場外, 公寓及城市屋為平衡市場。
6月份的房價指數(HPI)為1,207,100元,較5月的1,212,000元略有下降0.4%,但較2023年6月的1,203,000元上升了0.3%,為今年首次價格向下調整。
雖然大多數地區處於買方市場,但也有一些例外。如果您想了解您所在地區的市場表現,請下載下面的免費市場報告。如果您有任何問題,歡迎跟我聯繫。